


Okay guys, let’s talk about Bitcoin. VERY long post here, but we have a lot of issues to cover…
If you don’t agree with what I’m about to say, that’s perfectly fine, this is just my opinion based on multiple technical factors and how BTC has reacted when these factors have emerged in the past.

To begin with, and this has been my opinion for all of 2022, no one should own ANY crypto at this time…
The crypto casino is imploding, and I have reason to believe it has a lot further to fall. In buying Crypto, you are basically investing in the 2000 Dot Com crash and Bernie Madoff’s Ponzi scheme. At least for now, until this entire sector is wiped out, and most of the 16,000 coins disappear, revealing the ones with a real future. But that time is still far away from where we are right now.
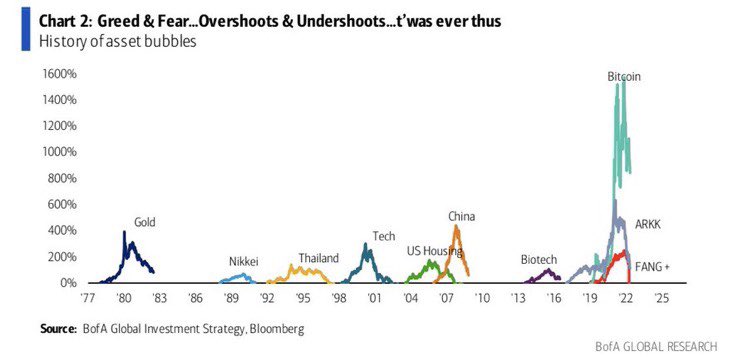
The crypto crash rivals both the internet bubble burst and the Great Financial Crisis.
Bank of America
What Happened With TerraUSD (UST) & LUNA Stablecoins? Will Junk Bonds Backed Crypto Recover In 2022
Terra Luna, considered the superstar of 2022, with the brightest of futures, has been delisted from most exchanges. Nadeem was correct many months ago when he warned about stablecoins, and what happened with Terra / UST could basically happen with any other stablecoin. If USDT cracks, with 82 billion locked, the entire crypto sector will go nuclear on the downside. This is NOT the time to be owning crypto. They will continue to fall much further before this all shakes out.
As for Bitcoin (and the entire sector, considering 99% of coins follow BTC trends) any talk on the internet of BTC moving soon to $100,000 is utter nonsense, release any thoughts of BTC at 100k from your minds.
Indicators Leading To A Bloodbath – Can A Lagging Bitcoin (BTC) Survive Bear Market 2022?
This is the FIRST time in Bitcoin’s 13 year existence that it is participating in a true bear market, remember it was created AFTER the Global Financial Crisis of 2008-2009. And, it is NOT handling this bear market well – dropping 60% from the 69k high in November, to the recent $26,000 zone this week.
This bear market has seen BTC outperform stocks on the downside. BTC should NOT be owned at this time. Take advantage of any possible rallies in the coming days to liquidate your holdings. There’s a chance you’ll get $35,500 on a bounce, but it’s highly unlikely you’ll get past that point, IF it even makes it that far. The $35,500 zone is the site of a strong down-trending Fibonacci Optical resistance line that BTC first struck at $48,200 in late March. It has repeatedly tried to breach the Fibonacci resistance, and failed every time. Even if BTC bounces as high as $35,500 (which would be a real reach to begin with), it will surely be rejected again by the powerful Fib resistance line, which has controlled it thus far.
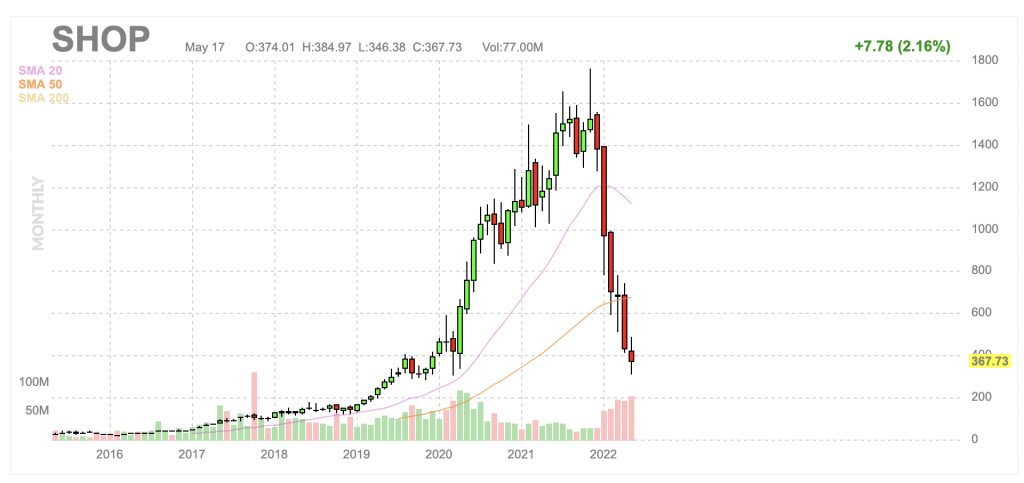
You have to understand, when Bitcoin rallied from $3,000 to $66,000 after the Covid lows, it created a highly dangerous parabolic chart pattern. By investing in Bitcoin now, you are taking on a highly risky position. You can see a monthly chart of Shopify (go to finviz.com) for what happens with parabolic chart patterns. They often form Xmas tree patterns, a straight line up on the left side, a topping pattern, and then all the way back down the right side. MOST parabolic chart patterns usually end with the Xmas tree pattern.
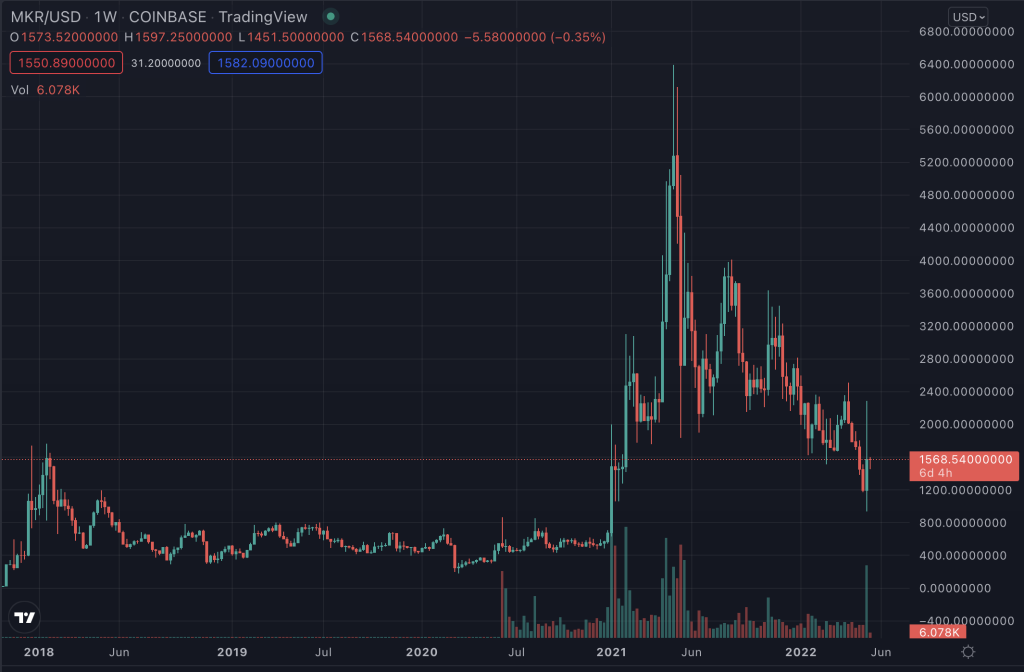
Check out MakerDAO’s MKR coin, currently trading at $1,375 at the time of writing, which went from $300 to $6,000 in a very short period of time. Do you know where Maker is headed? We’re going to see a Xmas Tree pattern and the price will drop all the way back down to $300-400.
Why does it happen so often? Because parabolic chart patterns create areas where there is simply NO volume control. There is no POC, or point of control. They create air pockets as a result of the left-side parabolic rise, which,for the most part, never stopped to create strong support zones.
Bitcoin is severely lacking volume control below $30,000. The next major area of volume control lies only around $10,000. Could Bitcoin really return to $10,000? Absolutely, and it could even go down to $5,000. But where is it headed now, and why?
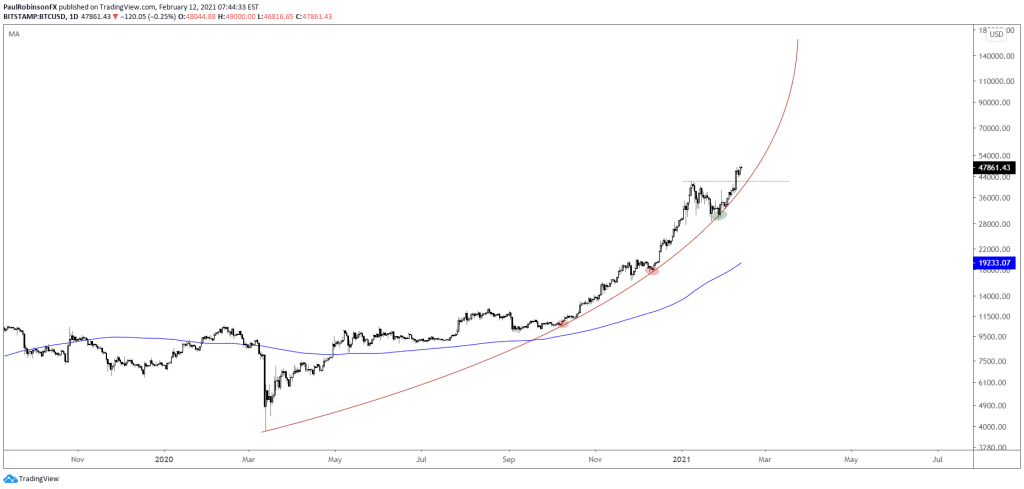
Throughout its existence, Bitcoin has only crossed the monthly MACD to the downside three times. It just did it again with the April monthly close. EVERY other time, the downside MACD cross has ushered in fairly significant lower prices, within 3-5 months. Our main target is the rising 200-week moving average, which is now near $21,850 and climbing daily. This area will be hit in the coming weeks, and usually BTC will overshoot it by a bit with a wick through it. It’s most likely going to end up roughly around $21,000 in the coming weeks. We should definitely see that 200 week moving average struck by early July. Again, a lack of volume support owing to the parabolic rise from 3k to 66k could lead to a very fast drop to these levels. In the late May to early June timeframe, harmonic cycles, short, medium, and long-term, are nesting to a converging low, which will put downward pressure on BTC.
The Gaussian channel has just turned from green to red for BTC, this has rarely happened before, and EVERY time it has happened, it has brought about a significant drop in price in the short to medium term.
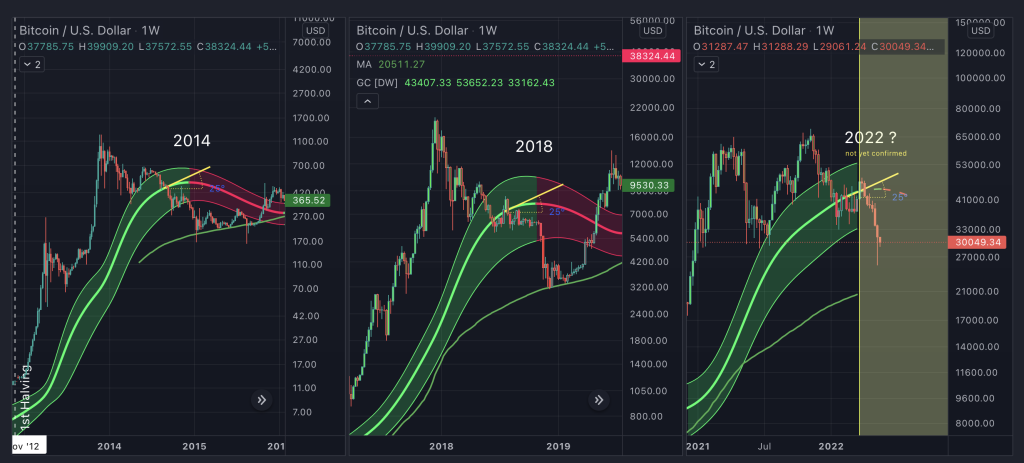
BTC is also about to issue a death cross, which historically has also ushered in lower prices.
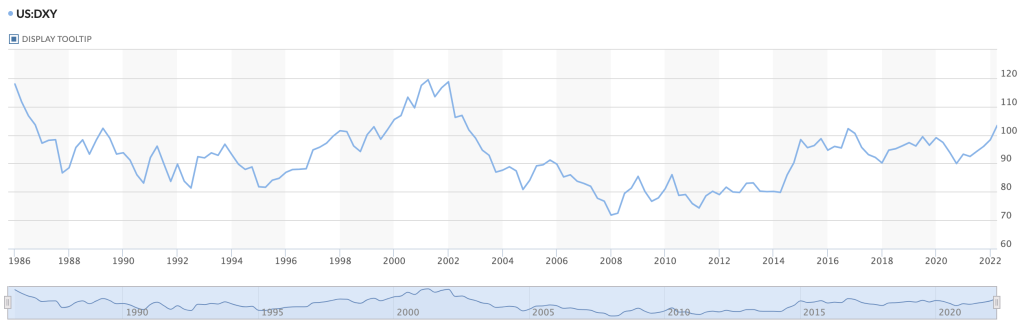
When it comes to Bitcoin’s history, there have only been two extended rallies, one in 2017 and one in 2020 to early 2021, both during the times when the U.S. Dollar index was in a free-fall. Take a look at the U.S. Dollar Index(DXY) Chart at Marketwatch.com to confirm this. They have an inverse relationship.
Take a look at the long-term monthly DXY chart now. You will find that DXY is basically breaking out RIGHT NOW.It’s a 20 year breakout! DXY is forecasting a move to 120 from 104. The next year or two are expected to be very bullish for DXY. Inflation is out of control, and the Fed would be forced to tighten its monetary policy to avoid hyperinflation. The trend is UP for the DXY. Bitcoin has never shown ANY ability to have an extended long-term rally when the DXY was NOT falling significantly.
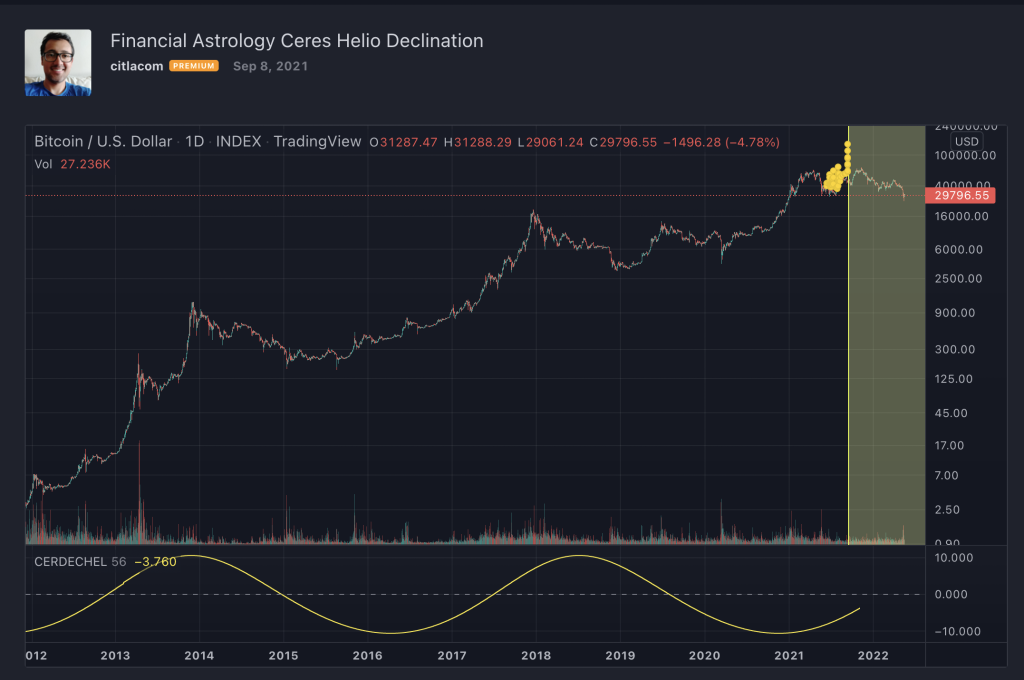
Power Of Ceres & Correlation With Future Of Crypto – Western Financial Astrology Predictions For Bitcoin (BTC) Value 2022
If you still want to add insult to injury, let’s talk about astrological cycles as well. Due to some mysterious reason, Bitcoin has tracked the declination cycle of Planet Ceres very accurately for many years. Ceres will begin entering a southward-pointing declination cycle in July 2022 and continue through mid-2024 (two years). The price of Bitcoin has historically declined when Ceres enters a downward declination cycle.
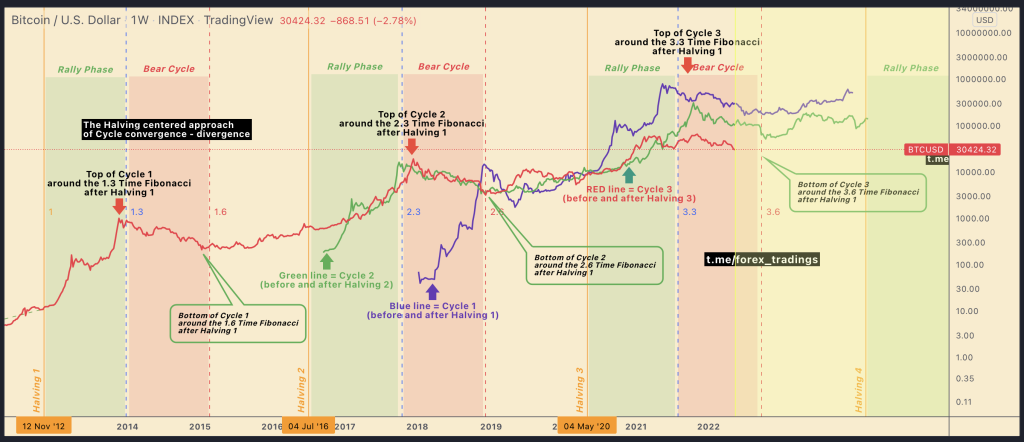
Next, let’s discuss the halving cycle. It’s fine if you believe in the 4 year halving cycle. If you plot them on a chart, the 2020 cycle is roughly halfway through the 2012 and 2016 cycles. So where do we stand now? We are in the phase of the 4 year halving cycle where LOWER prices emerge. We should be able to see a LOW put in place around September through October (according to the 4-year halving cycle).
Maintaining the four-year halving cycle, new highs are not usually reached until roughly 1100 – 1200 days after the previous high. The previous high was set in November of 2021, when 69k was reached. That means we should NOT expect a rechallenge of the 69k high until Nov of 2024 to early 2025. That would mean 100k would not even be considered reasonable until late 2025 or early 2026.
Overall, there are A LOT of factors pointing to falling Bitcoin prices. This is NOT the time for FOMO. This is the time to bail out and wait for lower prices. Early July should see roughly $21,000 on a slight break from the 200 week moving average. We can reassess from there, but eventually Bitcoin will probably break through the lack of volume support on the chart, quite easily slipping to $12,000 to $15,000. There is a major chart support at $12,000, and volume support begins to emerge again.
If you are interested in purchasing BTC, this is not the time. You must keep patience; there is no logical reason to believe that BTC won’t be heading down quite a bit this spring / summer.
Patience.
Good luck trading!